数据重播
原文: https://www.backtrader.com/docu/data-replay/data-replay/
时间一去不复返了,在一个完全成型的封闭酒吧中测试一个策略是好的,但它可能会更好。
这就是数据重播提供帮助的地方。如果:
- 该策略对时间范围为 X 的数据进行操作(例如:每日)
和
- 可获得较小时间段 Y(例如:1 分钟)的数据
数据重播的作用与名称的含义完全相同:
- 使用 1 分钟的数据重播每日条形图
当然,这并不完全是市场发展的方式,但它远比孤立地看待每日完全成形和封闭的酒吧要好得多:
如果策略在每日酒吧的形成过程中实时运行,酒吧形成的近似值提供了在真实条件下复制策略实际行为的机会
将数据回放付诸实施遵循backtrader的常规使用模式
-
加载数据源
-
通过
replaydata将数据传递给大脑 -
添加策略
笔记
重放数据时不支持预加载,因为每个条实际上都是实时构建的。在任何Cerebro实例中自动禁用。
可传递给replaydata的参数:
-
timeframe(默认值:bt.TimeFrame.Days)有用的目标时间范围必须等于或大于源时间范围
-
compression(默认值:1)将所选值“n”压缩到 1 巴
扩展参数(如果不是真的需要,请勿触摸):
-
bar2edge(默认为 True)使用时间边界作为闭合条的目标进行回放。例如,使用“滴答声->5 秒”,生成的 5 秒条形图将与 xx:00、xx:05、xx:10 对齐…
-
adjbartime(默认为 False)使用边界处的时间调整交付的重采样条的时间,而不是上次看到的时间戳。如果重新采样为“5 秒”,则即使最后看到的时间戳为 hh:mm:04.33,条形图的时间也将调整为 hh:mm:05
注:只有当“bar2edge”为真时,才会调整时间。如果该条未与边界对齐,则调整时间是没有意义的
-
rightedge(默认为 True)使用时间边界的右边缘设置时间。
如果为 False 并压缩到 5 秒,则 hh:mm:00 和 hh:mm:04 之间的重新采样条的秒时间将为 hh:mm:00(起始边界)
如果为 True,则该时间使用的边界将为 hh:mm:05(结束边界)
为了使用示例,将每周重播标准的 2006 年每日数据。这意味着:
-
最终将有 52 家酒吧,每周一家
-
大脑将调用
prenext和next总共 255 次,这是每日酒吧的原始计数
诀窍:
-
当形成一个周线时,策略的长度(
len(self)将保持不变。 -
每过一周,长度将增加一个
下面是一些示例,但首先是测试脚本的示例,在该脚本中,数据被加载并通过replaydata传递到 Cerbero……然后是run。
 # Load the Data
    datapath = args.dataname or '../../datas/2006-day-001.txt'
    data = btfeeds.BacktraderCSVData(dataname=datapath)

    # Handy dictionary for the argument timeframe conversion
    tframes = dict(
        daily=bt.TimeFrame.Days,
        weekly=bt.TimeFrame.Weeks,
        monthly=bt.TimeFrame.Months)

    # First add the original data - smaller timeframe
    cerebro.replaydata(data,
                       timeframe=tframes[args.timeframe],
                       compression=args.compression)
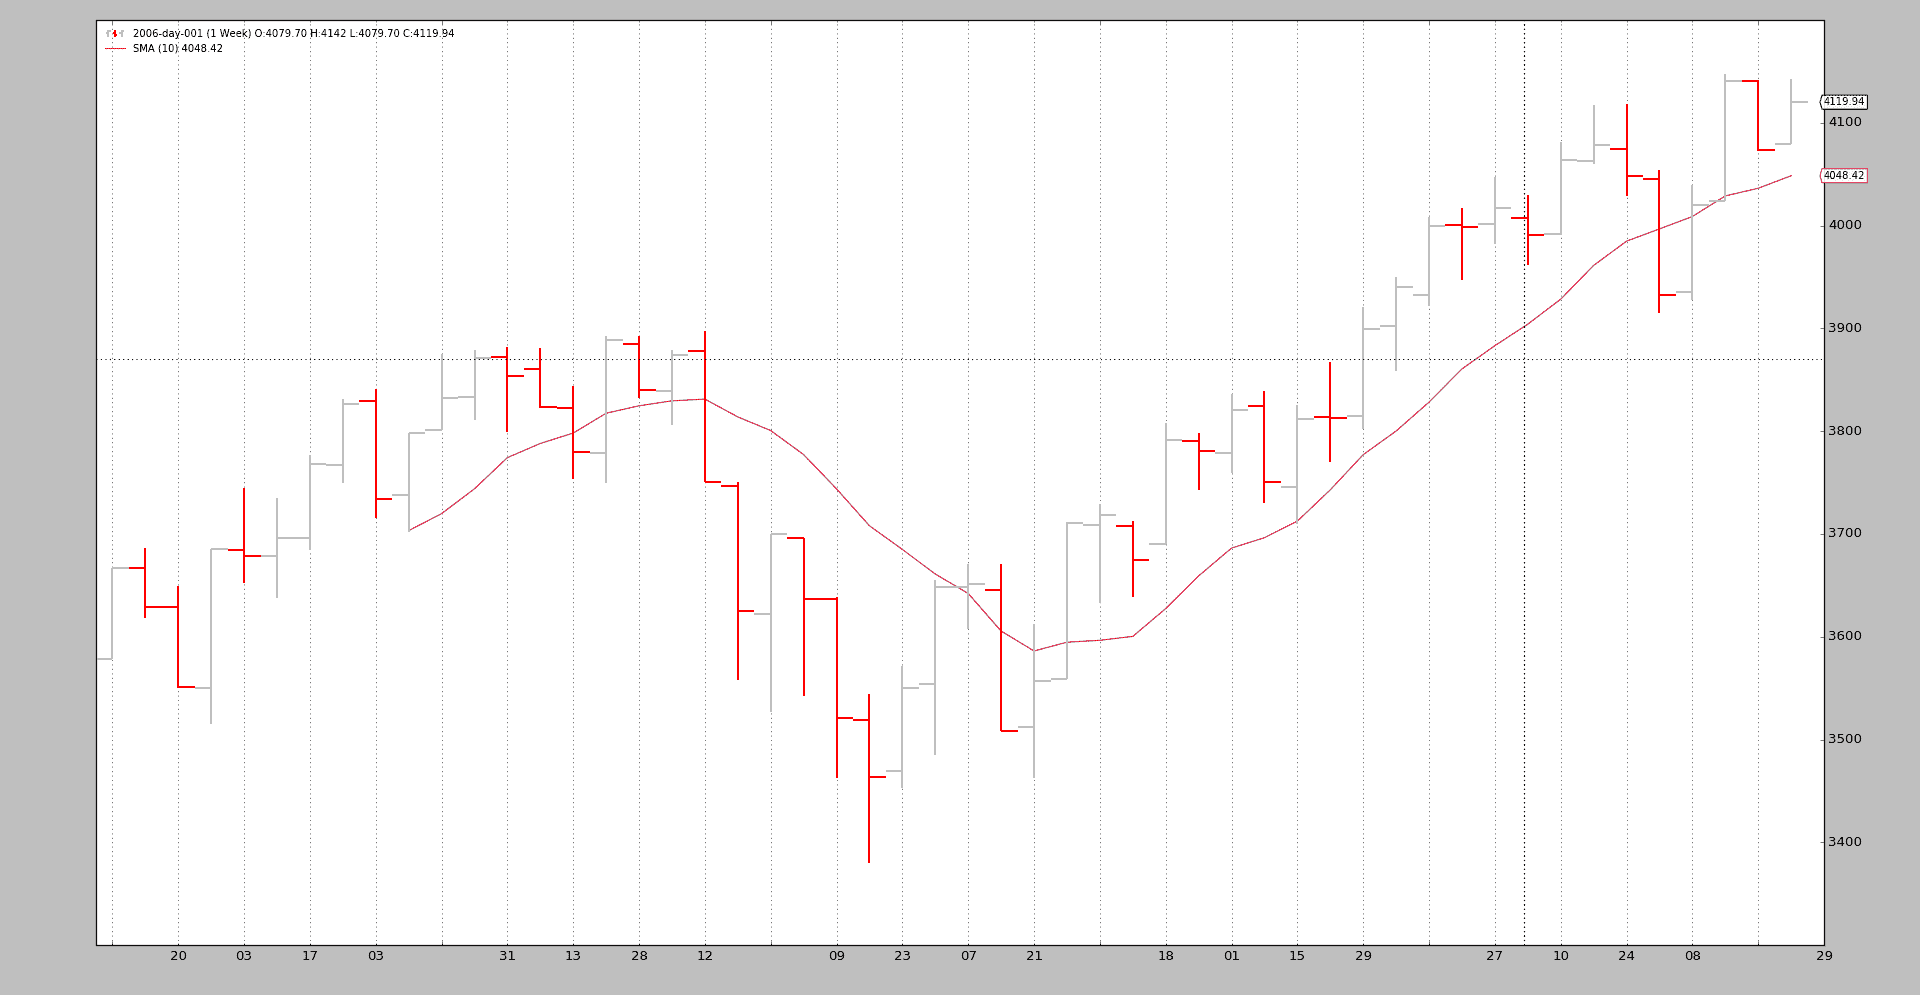
示例-从每天重播到每周重播
脚本的调用:
$ ./replay-example.py --timeframe weekly --compression 1
不幸的是,该图表无法向我们显示背景中发生的真实情况,因此让我们看看控制台输出:
prenext len 1 - counter 1
prenext len 1 - counter 2
prenext len 1 - counter 3
prenext len 1 - counter 4
prenext len 1 - counter 5
prenext len 2 - counter 6
...
...
prenext len 9 - counter 44
prenext len 9 - counter 45
---next len 10 - counter 46
---next len 10 - counter 47
---next len 10 - counter 48
---next len 10 - counter 49
---next len 10 - counter 50
---next len 11 - counter 51
---next len 11 - counter 52
---next len 11 - counter 53
...
...
---next len 51 - counter 248
---next len 51 - counter 249
---next len 51 - counter 250
---next len 51 - counter 251
---next len 51 - counter 252
---next len 52 - counter 253
---next len 52 - counter 254
---next len 52 - counter 255
正如我们看到的,内部的self.counter变量正在跟踪对prenext或next的每次调用。在应用简单移动平均线生成值之前调用前者。当简单移动平均值产生值时,调用后者。
关键是:
- 策略的长度(len(self))每 5 条(一周中的 5 个交易日)改变一次
该战略有效地看到:
-
每周酒吧如何在 5 次拍摄中发展。
同样,这并没有复制市场的实际逐点(甚至不是每分钟、每小时)发展,但它比实际看到一个酒吧要好。
视觉输出是周线图的输出,周线图是系统再次测试的最终结果。
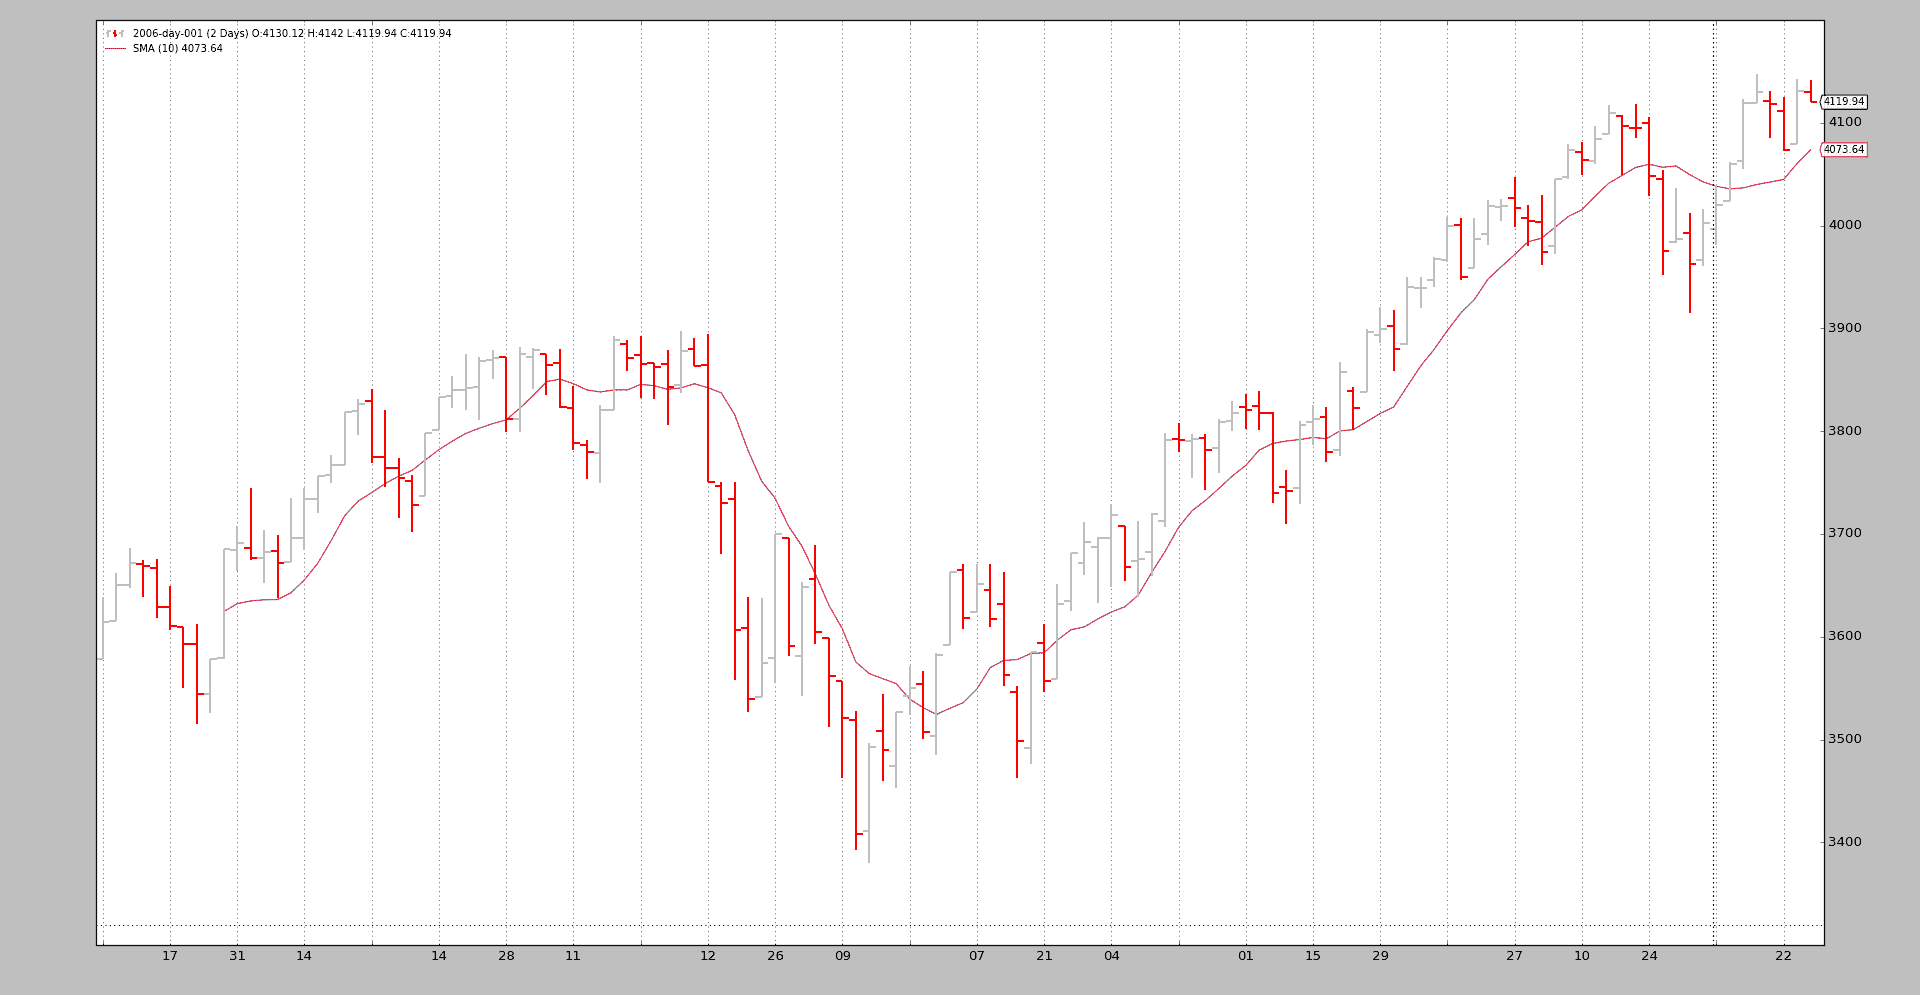
示例 2-每日到每日压缩
当然,“重放”可以应用于相同的时间段,但需要压缩。
控制台:
$ ./replay-example.py --timeframe daily --compression 2
prenext len 1 - counter 1
prenext len 1 - counter 2
prenext len 2 - counter 3
prenext len 2 - counter 4
prenext len 3 - counter 5
prenext len 3 - counter 6
prenext len 4 - counter 7
...
...
---next len 125 - counter 250
---next len 126 - counter 251
---next len 126 - counter 252
---next len 127 - counter 253
---next len 127 - counter 254
---next len 128 - counter 255
这一次,由于因子 2 要求的压缩,我们得到了预期的一半钢筋。
图表:
结论
重建市场发展是可能的。通常有一组较小的时间段数据可用,可用于离散地重播系统运行的时间段。
测试脚本。
from __future__ import (absolute_import, division, print_function,
                        unicode_literals)

import argparse

import backtrader as bt
import backtrader.feeds as btfeeds
import backtrader.indicators as btind

class SMAStrategy(bt.Strategy):
    params = (
        ('period', 10),
        ('onlydaily', False),
    )

    def __init__(self):
        self.sma = btind.SMA(self.data, period=self.p.period)

    def start(self):
        self.counter = 0

    def prenext(self):
        self.counter += 1
        print('prenext len %d - counter %d' % (len(self), self.counter))

    def next(self):
        self.counter += 1
        print('---next len %d - counter %d' % (len(self), self.counter))

def runstrat():
    args = parse_args()

    # Create a cerebro entity
    cerebro = bt.Cerebro(stdstats=False)

    cerebro.addstrategy(
        SMAStrategy,
        # args for the strategy
        period=args.period,
    )

    # Load the Data
    datapath = args.dataname or '../../datas/2006-day-001.txt'
    data = btfeeds.BacktraderCSVData(dataname=datapath)

    # Handy dictionary for the argument timeframe conversion
    tframes = dict(
        daily=bt.TimeFrame.Days,
        weekly=bt.TimeFrame.Weeks,
        monthly=bt.TimeFrame.Months)

    # First add the original data - smaller timeframe
    cerebro.replaydata(data,
                       timeframe=tframes[args.timeframe],
                       compression=args.compression)

    # Run over everything
    cerebro.run()

    # Plot the result
    cerebro.plot(style='bar')

def parse_args():
    parser = argparse.ArgumentParser(
        description='Pandas test script')

    parser.add_argument('--dataname', default='', required=False,
                        help='File Data to Load')

    parser.add_argument('--timeframe', default='weekly', required=False,
                        choices=['daily', 'weekly', 'monhtly'],
                        help='Timeframe to resample to')

    parser.add_argument('--compression', default=1, required=False, type=int,
                        help='Compress n bars into 1')

    parser.add_argument('--period', default=10, required=False, type=int,
                        help='Period to apply to indicator')

    return parser.parse_args()

if __name__ == '__main__':
    runstrat()


