康纳斯 RSI
原文: https://www.backtrader.com/recipes/indicators/crsi/crsi/
谷歌为该指标提供的参考文献:
两个来源都同意该公式,但不同意术语(见下文)。连接器 RSI的计算如下:
CRSI(3, 2, 100) = [RSI(3) + RSI(Streak, 2) + PercentRank(100)] / 3
笔记
TradingView表示必须使用ROC(“变化率”)而不是PctRank(“百分比排名”),从TradingView本身提供的定义来看,这显然是错误的。
Streak是一个非标准的东西,需要一个定义,我们在这里参考来源(在TradingView行话中称为“UpDown”)
- 价格收盘高于/低于前一天的连续天数
- 如果一天的收盘价与前一天相同,则连胜将重置为
0 - 向上条纹产生正值,向下条纹产生负值
有了这个公式,理解我们需要使用PercentRank和Streak(或UpDown的明确定义,创建ConnorsRSI指标应该是一个孩子的游戏。
class Streak(bt.ind.PeriodN):
    '''
 Keeps a counter of the current upwards/downwards/neutral streak
 '''
    lines = ('streak',)
    params = dict(period=2)  # need prev/cur days (2) for comparisons

    curstreak = 0

    def next(self):
        d0, d1 = self.data[0], self.data[-1]

        if d0 > d1:
            self.l.streak[0] = self.curstreak = max(1, self.curstreak + 1)
        elif d0 < d1:
            self.l.streak[0] = self.curstreak = min(-1, self.curstreak - 1)
        else:
            self.l.streak[0] = self.curstreak = 0

class ConnorsRSI(bt.Indicator):
    '''
 Calculates the ConnorsRSI as:
 - (RSI(per_rsi) + RSI(Streak, per_streak) + PctRank(per_rank)) / 3
 '''
    lines = ('crsi',)
    params = dict(prsi=3, pstreak=2, prank=100)

    def __init__(self):
        # Calculate the components
        rsi = bt.ind.RSI(self.data, period=self.p.prsi)

        streak = Streak(self.data)
        rsi_streak = bt.ind.RSI(streak, period=self.p.pstreak)

        prank = bt.ind.PercentRank(self.data, period=self.p.prank)

        # Apply the formula
        self.l.crsi = (rsi + rsi_streak + prank) / 3.0
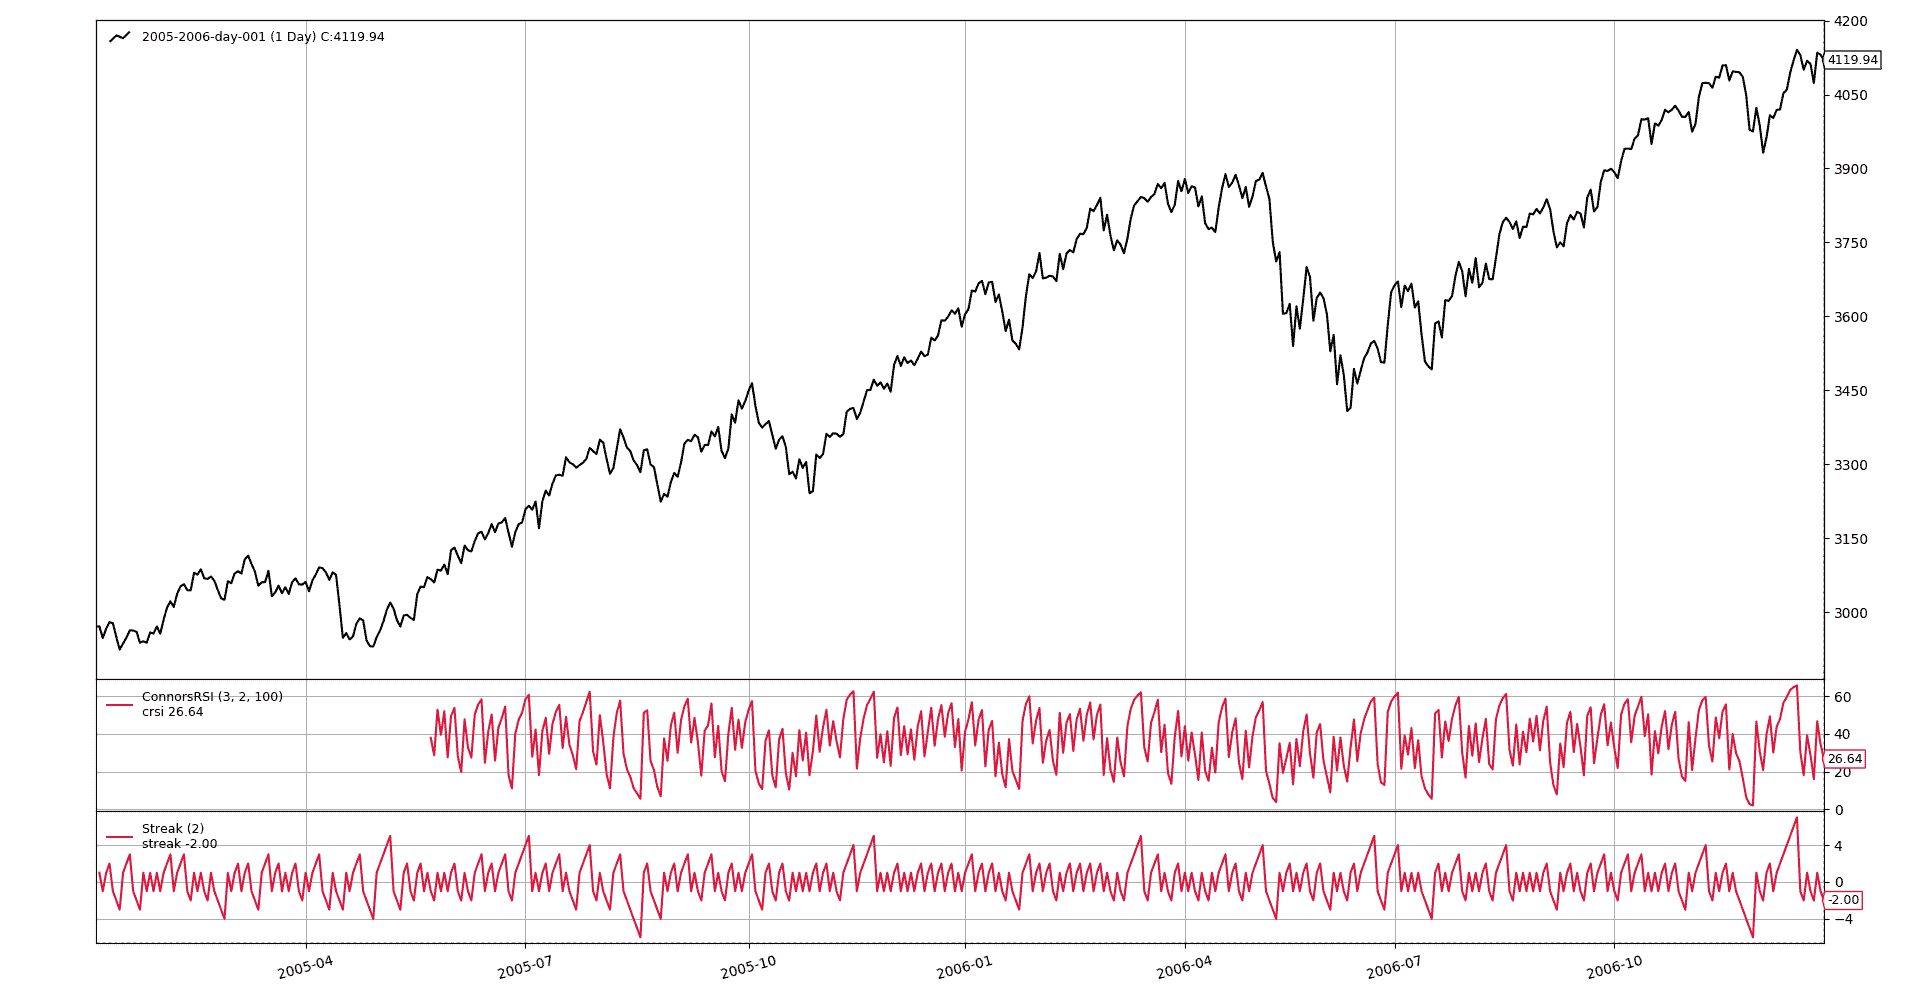
这里是一个指示器如何工作的视图,包括Streak辅助指示器,以进行实际条纹交付的视觉验证。


